
The Economist Impact Resilient Food Systems Index has ranked the UK as the third most resilient food system in the world, which is quite astounding. This didn’t seem quite right, so I had a closer look at the methodology.
What the index actually measures
The Economist Impact Resilient Food Systems Index, published in March 2026, ranks 60 countries across 71 indicators grouped into four pillars: affordability, availability, quality and safety, and climate risk responsiveness. It’s a welcome attempt to benchmark food system resilience globally, and it’s worth saying upfront that this is genuinely hard.
Quantifying resilience means pinning a number on interconnected, cascading, constantly changing multivariable challenges. Every organisation attempting this runs into the same problem, and the Economist team has done a credible job with the data available.
The UK comes out third overall, behind Portugal and France, and first globally on climate risk responsiveness. That headline is the bit I want to interrogate. And when I went into the data workbook behind the index, it seems there are some pretty big blindspots. The UK scores 88.94 for affordability, 63.12 for availability, 82.18 for quality and safety and 71.27 for climate risk responsiveness.
Why does the UK rank first for climate risk responsiveness?
The climate risk pillar blends physical climate exposure, disaster management capability and mitigation commitment. The UK scores extremely well on the first two: we have a temperate geography, comparatively low physical exposure to the worst climate impacts today, and strong institutional capacity to manage disasters when they happen.
Where the ranking gets uncomfortable is the third piece. Our score on political commitment to climate mitigation is very low. In other words, the UK ranks first on responsiveness largely because we haven’t yet been tested, not because we are doing the work to prevent the test arriving. That’s a fragile kind of first place.
Where the story unravels
Availability is the UK’s weakest pillar, and that’s where the structural vulnerabilities start to show. Our irrigation infrastructure is near the bottom of the table, growth in agricultural productivity is middling and food security and access policy commitments are weak.
These point to a food system that works well in stable conditions but has limited adaptive capacity when things change.
The sufficiency of supply problem
Inside the availability pillar there’s an indicator called sufficiency of supply. It carries a 10% weight within the pillar, while the indicator contributes less than 3% to the UK’s overall ranking. That alone feels light for something so central to real resilience.
The bigger issue is what it actually measures. There are two sub-indicators. The first is food supply adequacy, using the FAO’s ADESA metric. Essentially, are there enough calories? The second is dependency on chronic food aid, where every high-income country scores full marks by default.
But neither sub-indicator asks where the food comes from! If you’re importing the vast majority of your fresh produce from climate-vulnerable regions, you score the same as a country that grows its own, which is slightly absurd. It doesn’t measure how fragile that availability is.
Why this matters for the UK specifically
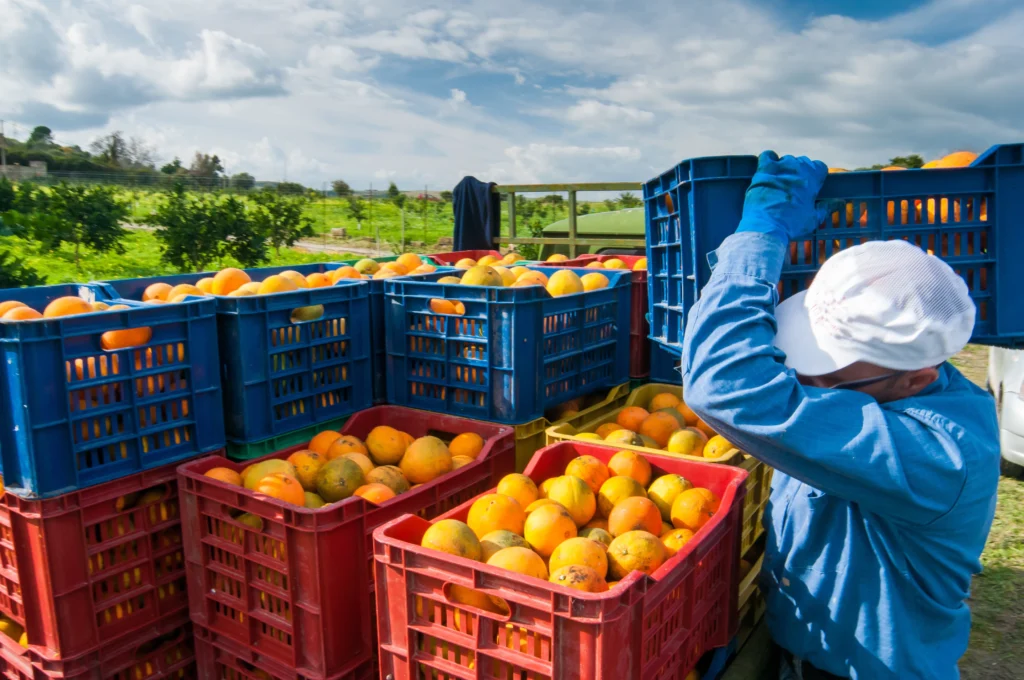
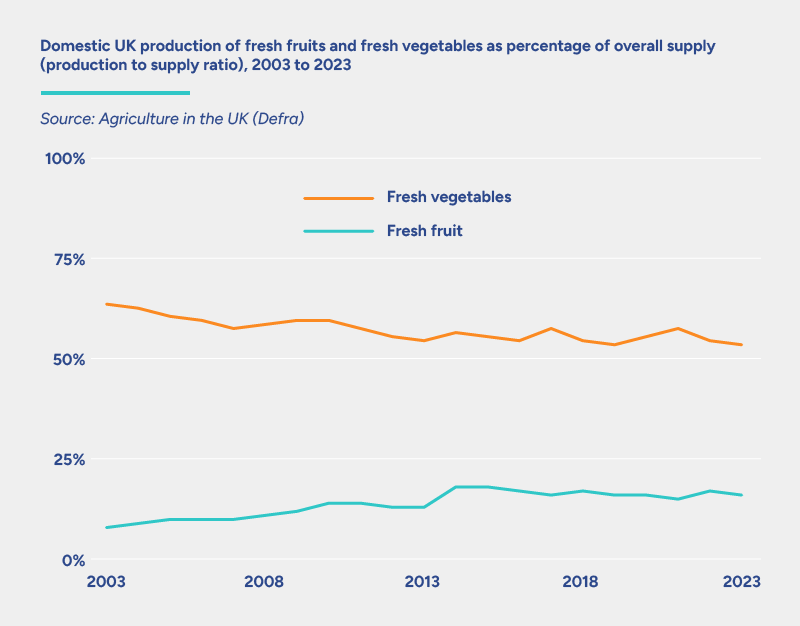
Self-sufficiency doesn’t seem to carry meaningful weight in the index, and yet it matters deeply. In the UK, fresh vegetable self-sufficiency has dropped to 53%, a record low since records began in 1988, and down from 63% as recently as 2003. Overall food self-sufficiency sits at around 62% today, having fallen from a peak of roughly 78% in the mid-1980s.
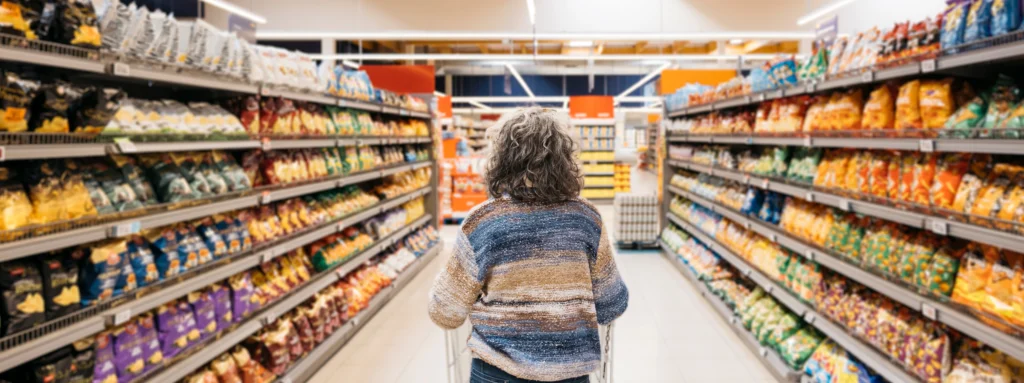
And what are we actually eating? Ultra-processed food accounts for over half (50.7%) of purchased dietary energy in the UK, the highest in Europe, compared to around 14% in Italy. We also have one of the most centralised, supermarket-dominated food systems in Europe, structurally designed to favour products that are scalable, standardised, cheap and shelf-stable.
So, we rank third for resilience globally, but our fresh food supply depends heavily on imports from countries that score significantly lower on the same index, and we distribute it through a highly centralised system.
A system that depends on imports from climate-vulnerable regions for its fresh produce while domestically optimising for ultra-processed shelf life is not resilient in any meaningful sense. It may be efficient, but that’s not the same thing.
The UK Government’s own Health Effects of Climate Change report states that by 2050, 52% of legumes and 47% of fruit would be imported from climate-vulnerable countries. Supply of vegetables, fruit and legumes is projected to fall short of what would be needed to meet UK dietary recommendations.
When framed this way, that doesn’t really feel like resilience does it? And when climate change gets really bad, I wonder how easy it’ll be for us to import food as we have.
What a better resilience indicator could look like
If I were designing a more robust version of the sufficiency of supply indicator, I’d want it to capture at least three things the current version misses:
- Sourcing geography risk: for each major food category, where is the country importing from, and what is the climate vulnerability of those sourcing regions? The ND-GAIN Index already scores countries on climate readiness. Overlaying import dependency data with climate vulnerability scores of exporting countries would tell you how exposed your food supply actually is. A country importing 80% of its fruit from regions facing severe water stress or rising temperatures is materially less resilient than one with diversified or domestic supply, even if the calories are arriving today.
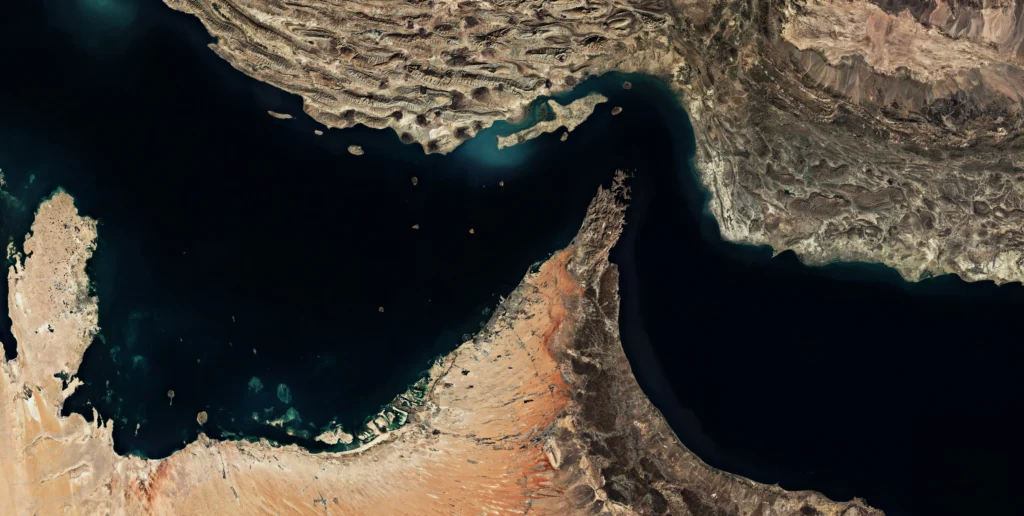
- Supply route concentration and redundancy: how many distinct supply corridors exist for critical food categories? Are there alternative routes if a key trade channel is disrupted by geopolitical tension, extreme weather or infrastructure failure? The Suez Canal disruption in 2021 showed how a single chokepoint can cascade through global food logistics. The Strait of Hormuz shutting down is showing us our dependency on fossil-fuel based fertilisers. A resilience index should penalise over-reliance on concentrated supply routes, but to be fair this would likely penalise all countries similarly.
- Domestic agricultural production trajectory: is a country investing in its own agricultural capacity, or is it allowing domestic production to decline? The index does include a volatility of agricultural production indicator (2.4), which rewards stable year-on-year output, but stability and trajectory are not the same thing. The UK’s horticulture sector is a case in point: 40% of strawberry and raspberry growers could cease operations by 2026 according to the British Berry Growers survey, and Riverford’s Get Fair About Farming campaign has flagged that nearly half of UK farmers fear going out of business in the next year. The House of Lords Horticultural Sector Committee report has made similar points about structural underinvestment. A resilience index shouldn’t ignore the (potential) erosion of domestic productive capacity.
What this means in practice
Resilience is a value-laden word: how you measure it reflects how you think the world and the food system should operate. An index built on free-market assumptions – like the one from The Economist – will tend to reward diversified global sourcing over domestic investment, because the latter looks more expensive and less efficient in steady-state conditions. An index built on food sovereignty assumptions would score the same country very differently. Neither is neutral.
That’s why public policy matters so much here. A stable, cross-party vision for UK food system resilience, with clear rules of the game, would allow businesses to invest with confidence in longer-term, shock-proof supply. Without that, we’re expecting individual companies to solve a systems problem on their own.
Resilience is one of those words that can mean very different things depending on what you choose to measure, and I worry that the headline ranking gives UK food businesses false comfort at a moment when we really can’t afford it. When you look at the scoring behind food supply adequacy and consider the absence of any real measurement of import dependency, the risk profile looks quite different.
At 3Keel we spend a lot of time helping businesses understand where the real vulnerabilities sit in their supply chains. Not just whether food is available and affordable today, but what happens when the systems providing it come under pressure. That starts with traceability mapping, layering in climate and nature risk on source regions, and then working out where to invest to make supply structurally less fragile. We’ve been writing about this in our resilience blog series and applying it in client work across key food commodities.
We are doing some deep thinking on how UK food businesses need to strategise better, and we’ll be releasing some frameworks and further thinking on this later this year. Watch this space.


